The Depict molecules (cdk-depict-mols) job can be used to display molecules in the Data Manager UI.
This job uses the CDK DepictionGenerator class to do the rendering and allows multiple structures to be rendered and a number of features to be displayed:
- The molecule structure
- Highlight a common substructure (MCS)
- Align to a common substructure
- Highlight atoms and bonds and display properties of those highlighted atoms
There are a large number of options available to control this, and the prime purpose of this article is to explain these.
Inputs and Outputs
Typically the input is a SD-file, optionally containing atomic properties to display (more on that later). Each molecule in the file will be rendered in a grid.
The output is an image file in PNG, SVG, JPEG or PDF. The format is automatically determined from the filename extension.
Once generated the file (either in the job results section or the project view) can easily be viewed by clicking on it and choosing “Browser View”.
Basic molecule display
This is done using the following options:
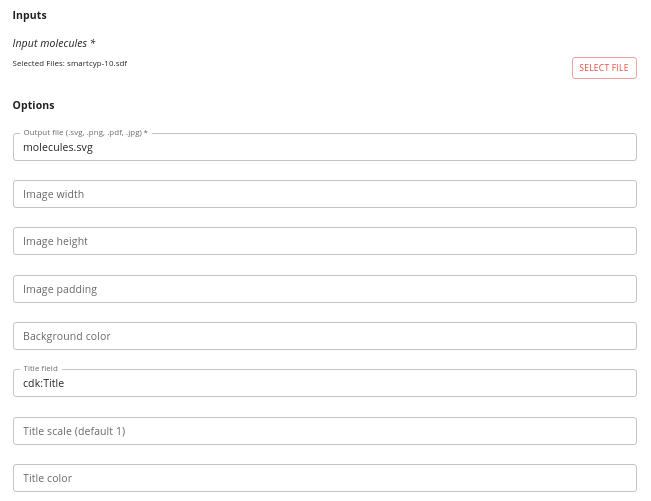
- Input molecules - the SD-file to render. Keep the number of molecules relatively small (a few tens) or the output can get unreadable.
- Image width and Image height - the dimensions of the image that will be generated (default is 500 x 500px).
- Image padding - padding around each image (default 5px).
- Background color - background color of the image (default white)
- Title field - the field to use to be displayed as the title of the molecule (the default of cdk:Title uses the title line - the first line of the SDF record). The title is displayed below the molecule.
- Title scale - the font for the molecule titles.
- Title color - the color of the titles
Note: colors are specified as text (e.g. red, yellow, black) and must be one of the constants used by Java here.
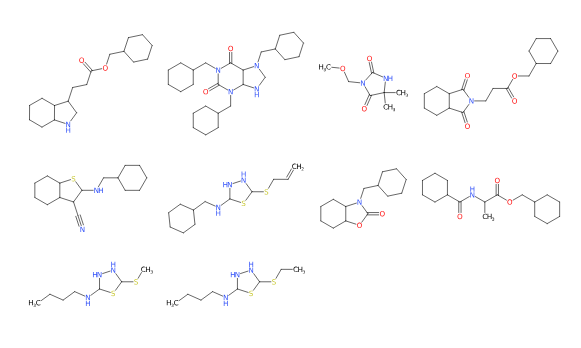
Running this is fairly straightforward, and using default options you get something like this:
Atomic properties
Atomic properties can be highlighted and displayed. These properties are encoded in the SD-file.
Currently we have two jobs that can generate this data, though in principle you could manually add this data to a file. The current jobs are:
- ChemAxon pKa calculator (chemaxon-molecular-props-pka) - this requires a ChemAxon license
- P450 predictions using SmartCyp (smartcyp-prediction) - use the simple output format
See the documentation for those jobs for how to run them.
They generate SD-file fields like this:
>  <CXN_APKA>
2 15.0

>  <CXN_BPKA>
4 -1.3
7 2.3
The format is one line per atom, each line having the atom number (starting from zero), a space and the value.
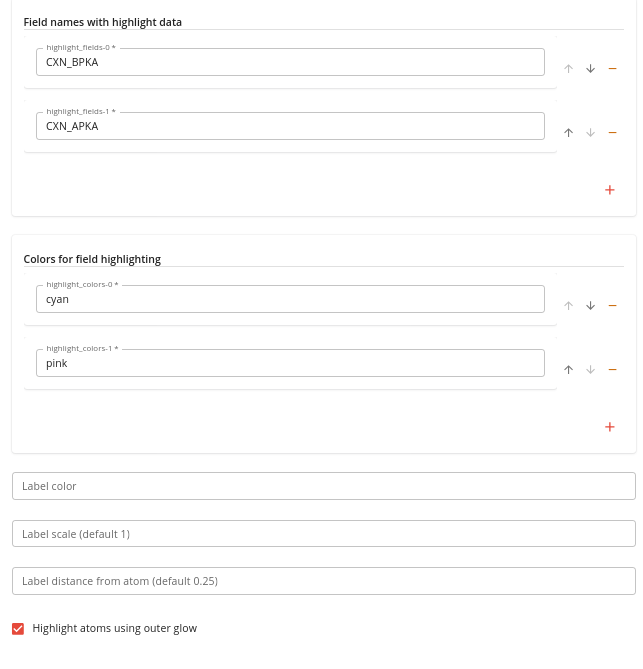
To render these values you need to specify:
- one or more field names
- corresponding colors for each field
- the Highlight atoms using outer glow option (to make the atoms clearly highlighted)
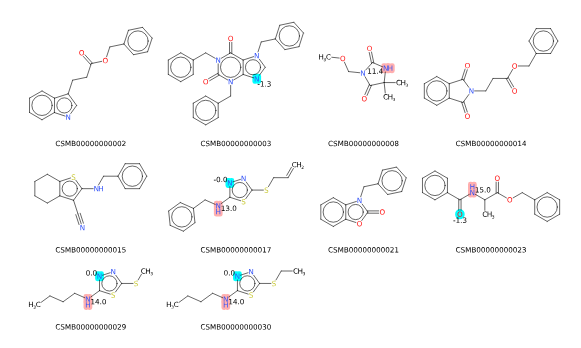
The output will look like this:
Other options
Other than cosmetic tweaks, the other main feature is to be able to specify a structure that is used to determine the Maximum Common Substructure (MCS) to each of the input molecules and to align the molecules to that MCS and to highlight the MCS. To do this use the MCS to highlight/align option to specify the SMILES of the query molecule and the MCS color option for the color to highlight the MCS.
NOTE: currently the MCS highlighting is not working correctly with only some atoms being colored.
Working example
We’ll now run through generating Cytochrome P450 metabolism predictions using SmartCYP and rendering those sites.
Running SmartCyp
Download the file linked below (or use your own) and upload it to your Data Manager project.
Once done go to the Executions tab and find the P450 predictions using SmartCyp job and click RUN.
inputs-10.sdf (18.1 KB)
Specify that file as the input and give the output a sensible file name.
Importantly, change the Score format option to “simple” so that the scores are written in the suitable format for rendering.
It should look like this:
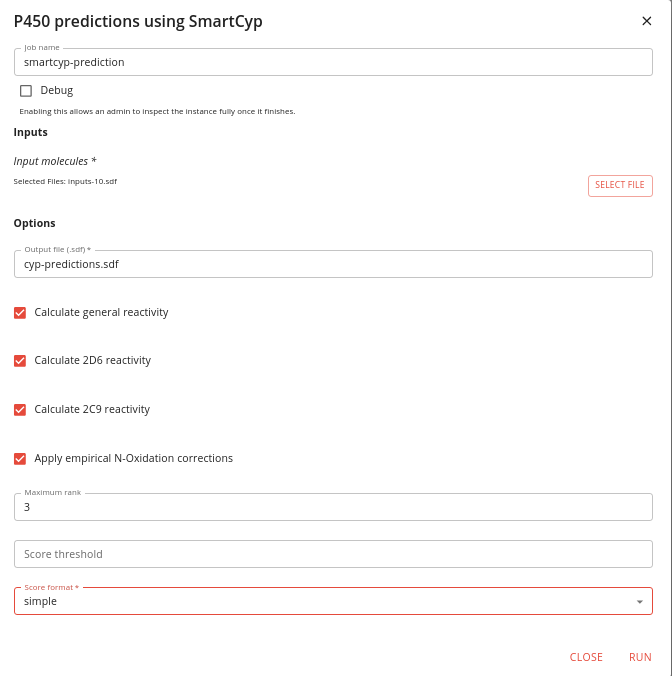
Click RUN and wait for the job to finish.
Running the depictor
Switch back to the Executions tab and find the Depict molecules job and launch it.
Specify the output of the last job as the input to this one and specify and output file name, using .svg as the file extension (other formats can be used).
Add one element to the Field names with highlight data option and specify “SMARTCyp_GEN” (or “SMARTCyp_2D6” or “SMARTCyp_2C9” if you’re more interested in those isoforms).
Add one element to the Colors for field highlighting option and specify a color to use. Also check the Highlight atoms using outer glow checkbox at the bottom. It should look like this:
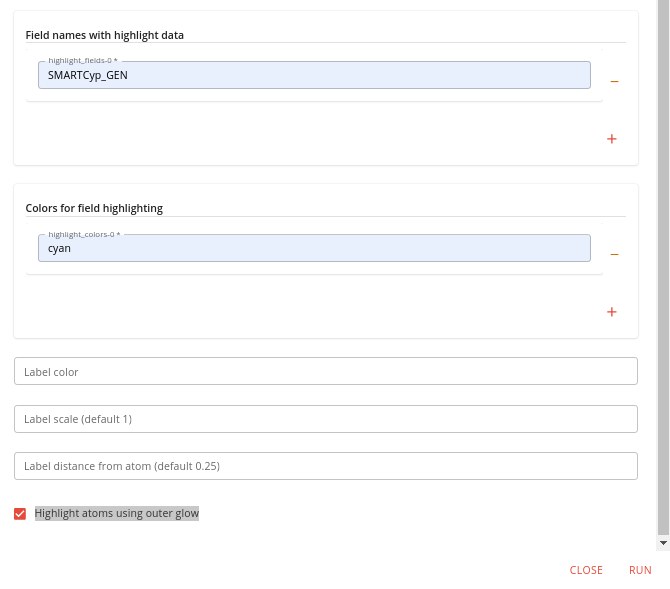
Now click RUN.
Click on the job’s instance in it’s card which will open it in the Results tab, When it is complete click on the output file and choose Browser view. That will open the SVG in a new browser tab for you to see the results.
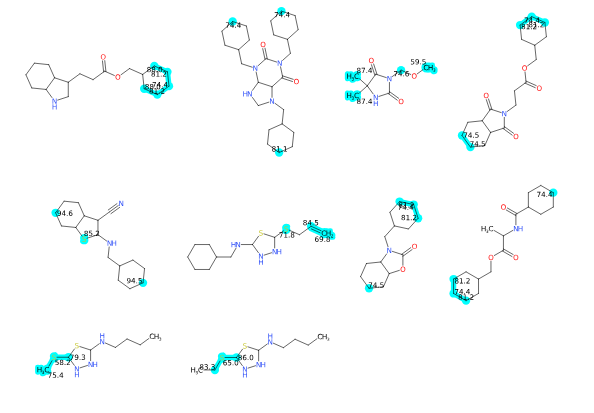
The labeling of the atoms is not perfect, but that can be tweaked a bit using the Label scale and Label distance from atom options according to your needs.